
| The Battle of Midway: Visual Research | ||
The main problem associated with a study of such complex battles as the Battle of Midway is that a variety of important spaced-apart events took place virtually simultaneously. Another problem consists of a great number of constantly moving “characters”, whose mutual arrangement and number at a particular moment are very difficult to keep in mind. Of course, maps and charts are of some real help in either case, but what they offer is just a general picture of the whole battle and not a mutual disposition of units at the particular moment. In the Visual Research project, I tried to visually simulate the relocation of units ensuring the maximum possible precision of timing and position referencing based on both primary sources—war diaries, action reports, etc.—and historical surveys. As a result, we get a chance to examine the bulk of information in quite a concise form with no risk of getting bogged down in huge amounts of coordinates, figures, dates, names, and events. |
 Updated: January 10, 2017 Updated: January 10, 2017 |
Technical requirements: Adobe Flash plug-in and a display with a minimum resolution of 1280×1024 are required for normal browsing. However, with this minimum resolution, you will need to switch your web browser to the fullscreen mode. Learn the visualization interface on the diagram below:
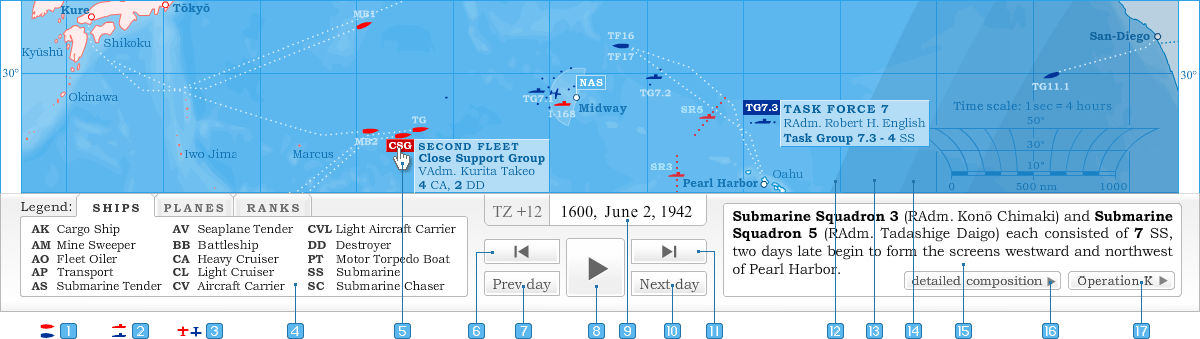
| 1. Surface ship or unit symbols | 6. Go to the previous event (disabled now) | 12. Terminator line | |
| 2. Submarine ship or unit symbols | 7. Go to the midnight of the previous day | 13. Civil twilight zone | |
| 3. Plane or aircraft unit symbols | 8. Play to the next event | 14. Nautical twilight zone | |
| 4. Lists of abbreviations used | 9. Current Midway time and date | 15. Brief description of the current event | |
| 5. Unit lable (mouse over for brief designation and composition, click for detailed ones) |
10. Go to the midnight of the next day | 16. Detailed composition of the unit(s) |
|
| 11. Go to the next event (disabled now) | 17. Additional information to the event |
The project is still in progress, but even in this phase, it’s helped us notice some of the details which were overlooked by those researchers, who had been examining the battle using conventional methods. Once the main stage of the project (the simulation of the relocation of forces and units) has been completed, it’s going to be extended to encompass more large-scale visualizations of air attacks as well as dynamic statistics—the time-synchronized number of planes in attack squadrons and combat air patrols, the number of planes lost and available at a given moment, etc.
If you have any corrections and improvements, or if you get a feeling that some important events have been left behind the scenes, please let the author know about it. However, do not forget to support your comments with references to the sources of information.
| Donate with |  |
or |  |